The i.MX RT600 MCU family from NXP is an interesting one. Not only do the i.MX RT600 devices feature a 300-MHz Arm Cortex-M33 processor core, but they also include a 600-MHz Cadence Tensilica HiFi4 DSP processor core. This makes the i.MX RT600 devices very suitable for audio playback and voice user interface applications.
However, having these two totally different CPU cores with very different development environments on the same chip also presents some unique challenges. For example: How do you establish and maintain debug sessions with both cores at the same time, with the same probe, in two different IDEs / debuggers? You can do it with the SEGGER J-Link – and ONLY with the SEGGER J-Link. This article shows you how it’s done.
The principle of debugging the i.MX RT600
In order to be able to access both the Cortex-M33 and the HiFi4 DSP cores on the i.MX RT600 from two separate development environments, the J-Link software includes a ‘locking mechanism’, i.e. a mutual exclusion feature, which is illustrated in the following image:
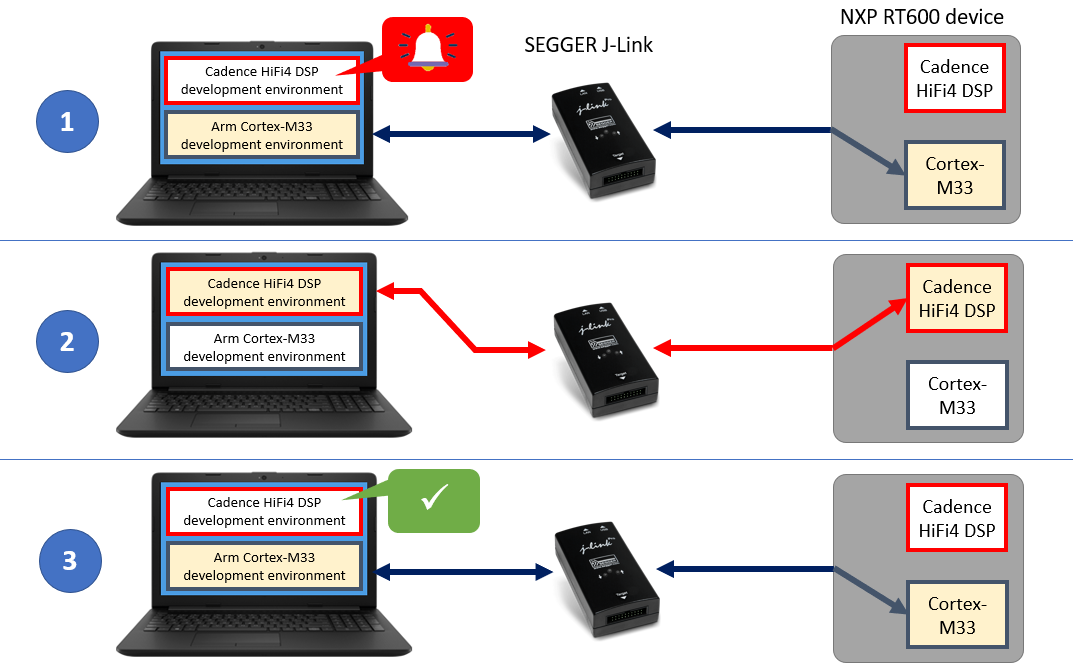
When Cadence’s environment needs access to the HiFi4 DSP, J-Link uses this mechanism to first tell the Cadence environment to hold off until any Arm Cortex-M33 related debug operations that might be in progress have reached a state where they can safely be put on hold (1). J-Link then grants the Cadence environment exclusive control of the JTAG/SWD interface during the time it needs it (2). Once the Cadence environment has completed its transactions, it releases the JTAG/SWD interface back to SEGGER control (3).
Getting Started with the NXP i.MX RT600
Before you can see how this mutual exclusion feature works in the real world, you need to set up your development environment(s) for the i.MX RT600.
If you are working with the i.MX RT600, you probably have a MIMXRT685-EVK evaluation kit. The board has an on-board LPC-Link2 debug probe, which by default is running a CMSIS-DAP based firmware. But with this firmware you won’t be able to debug The Cortex-M33 and the HiFi4 DSP cores in parallel. Luckily, you can re-program the on-board probe with a SEGGER J-Link firmware using the LPCScrypt tool from NXP. Of course, you can also connect an external (stand-alone) J-Link probe.
To develop the application code for the Cortex-M33 core, you need an IDE that supports the i.MX RT600, e.g. NXP’s MCUXpresso IDE (which allows easy access to the i.MX RT600 SDK from NXP), or SEGGER’s Embedded Studio IDE. These IDEs include a debugger to access J-Link. You can also use Ozone, SEGGER’s stand-alone debugger, to download and debug the Cortex-M33 code via J-Link.
To write and build the code that will be running on the HiFi4 DSP, your only choice is the Cadence Tensilica Xplorer IDE. The Xtensa On Chip Debugger (XOCD) Daemon is required to connect to J-Link from the Cadence side.
In the context of this blog article, the single most important document you need is this one:
- Getting Started with Xplorer for EVK-MIMXRT685.pdf
You can find this document inside the MIMXRT685-EVK SDK package from NXP, which you can download using the MCUXpresso SDK Builder.
The document tells you how to set up the complete development environment for the i.MX RT600, including the Xtensa Xplorer IDE and tools, the DSP build configuration, the Xtensa On Chip Debugger Daemon, the MCUXpresso SDK, etc. It also tells you how to program the LPC-Link2 on the MIMXRT685-EVK with the SEGGER J-Link firmware.
You will also need to refer to the document ‘Getting Started with MCUXpresso SDK for EVK-MIMXRT685.pdf’ for information on how to use the NXP SDK for the Cortex-M33 core. This document is also located inside the MIMXRT685-EVK SDK package.
Seeing the J-Link mutual exclusion feature in action
Time for some proof that this mechanism actually works. The “Getting Started with Xplorer for EVK-MIMXRT685.pdf” document currently also includes detailed instructions on how to run three examples of using both the Cortex-M33 (in the MCUXpresso IDE) and the HiFi4 DSP on the i.MX RT600 (in the Xplorer IDE) in parallel.
The demos each consist of two separate applications that run on the Arm core and the DSP core, respectively. The Arm core application initializes the DSP core and executes other application-specific functionality.
I recommend starting with the “Hello World” demo, as it includes further steps on how to set up the Cadence environment. However, to make this example a bit more interesting for the purpose of debugging, we are going to modify it just a little bit.
Getting a terminal going
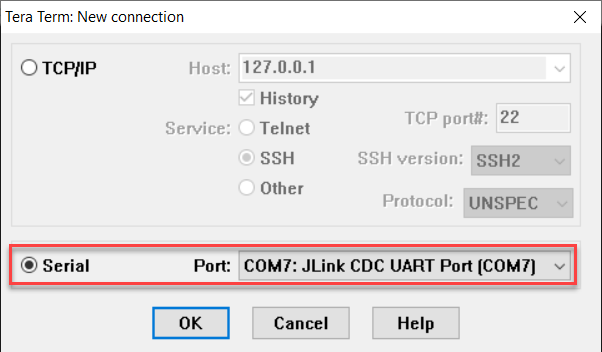
Because this demo produces output on the virtual COM port that the J-Link OB firmware provides, let’s open a terminal like TeraTerm or PuTTY at 115200 Baud.
Setting up the Cortex-M33 side of things
After importing the “dsp_hello_world_usart_cm33” SDK example project into MCUXpresso, the default main() function in main_cm.c looks like this:
int main(void)
{
  /* Initialize standard SDK demo application pins */
  BOARD_InitPins();
  BOARD_BootClockRUN();
  BOARD_InitDebugConsole();

  /* Print the initial banner */
  PRINTF("\r\nHello World running on core 'Cortex-M33'\r\n");

  /* Copy DSP image to RAM and start DSP core. */
  BOARD_DSP_Init();

  while (1);
}
Let’s add a variable and modify the while loop so we get some continuous output:
int main(void)
{
  volatile int i=0;

  /* Initialize standard SDK demo application pins */
  BOARD_InitPins();
  BOARD_BootClockRUN();
  BOARD_InitDebugConsole();

  /* Print the initial banner */
  PRINTF("\r\nHello World running on core 'Cortex-M33'\r\n");

  /* Copy DSP image to RAM and start DSP core. */
  BOARD_DSP_Init();

  while (1) {
    PRINTF("Hello World running on core 'Cortex-M33'\r\n");
    PRINTF("i = %d\r\n", i);
    i++;
  }
}
The video below shows building this code in MCUXpresso, and then downloading and running it on the i.MX RT685 using J-Link.
Now the DSP core is initialized, and the console view in MCUXpresso shows:
Hello World running on core 'Cortex-M33'
Hello World running on core 'Cortex-M33'
i = 0
Hello World running on core 'Cortex-M33'
i = 1
Hello World running on core 'Cortex-M33'
i = 2
Hello World running on core 'Cortex-M33'
...
In the virtual COM port terminal, we see:
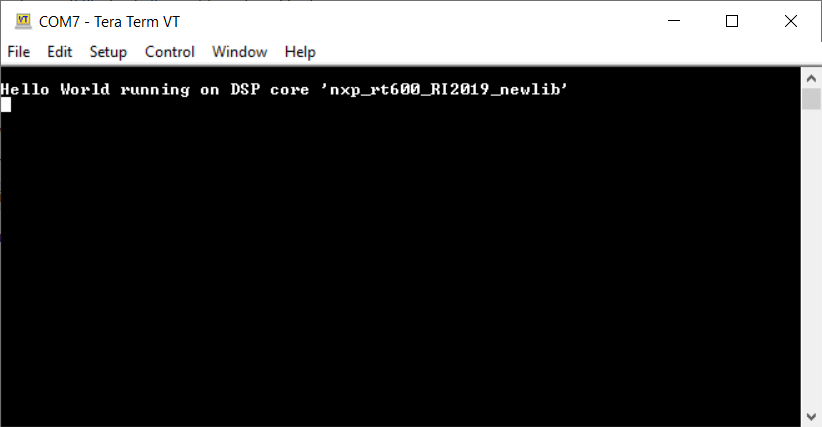
This is actually our first sign of life from the HiFi4 DSP!
But in order to do debugging on the DSP side, we still have some more work to do.
Getting things ready on the DSP side
Now we can start the Xtensa OCD Daemon:
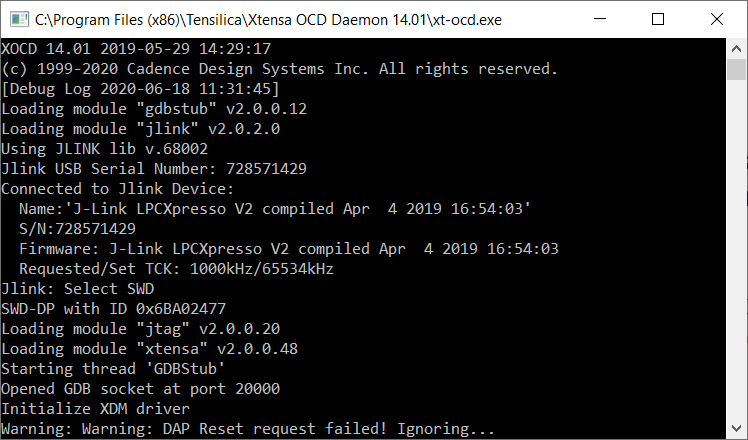
(Hint: Don’t do this before the DSP core is initialized…)
In the Xplorer IDE, we can now import the matching DSP core application project “dsp_hello_world_usart_hifi4” from the SDK.
(Note: Currently, the “Getting Started with Xplorer for EVK-MIMXRT685.pdf” instructs users to import the “dsp_hello_world_hifi4” project, which is similar, but technically not the true counterpart of the Arm project we loaded into the Cortex-M33.)
By default, the default main() function in main_dsp.c looks like this:
int main(void)
{
  /* Init board hardware. */
  BOARD_InitPins();
  BOARD_InitDebugConsole();

  PRINTF("\r\nHello World running on DSP core '%s'\r\n", XCHAL_CORE_ID);

  while (1)
  {
  }
}
Just like we did on the Arm side, lets add a variable and modify the while loop so we get some continuous output:
int main(void)
{
volatile int i=0;
/* Init board hardware. */
BOARD_InitPins();
BOARD_InitDebugConsole();
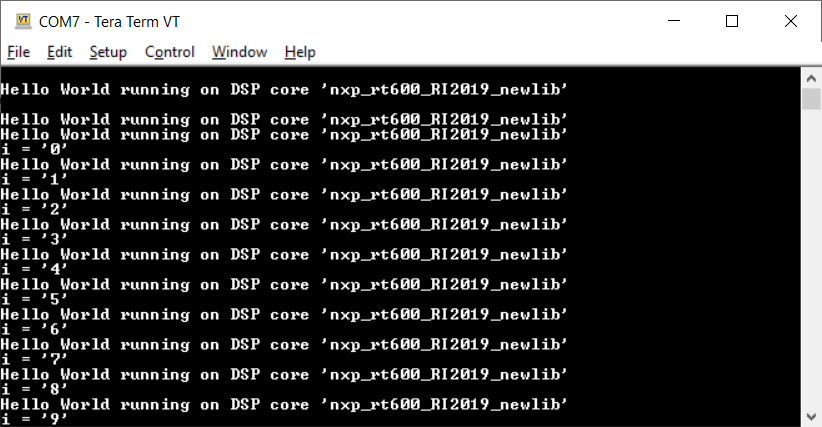
PRINTF("\r\nHello World running on DSP core '%s'\r\n", XCHAL_CORE_ID);
while (1)
{
PRINTF("Hello World running on DSP core '%s'\r\n", XCHAL_CORE_ID);
PRINTF("i = '%d'\r\n", i);
i++;
}
}
The video below shows building this code in Xplorer, and then downloading and running it on the i.MX RT685 using J-Link.
As we can see, we get the expected output in TeraTerm:
So right now we are running two separate applications, one on the Cortex-M33, and one on the HiFi4 DSP – and both are under J-Link control.
At this point we can debug each application independently. We can halt and resume code execution, set breakpoints, single-step through the code – all while using two separate IDEs/debuggers, two separate cores, and a single J-Link probe.
I captured some of this activity in the video below:
Summary
The NXP i.MX RT600 has two very different cores on board, which makes it a very interesting device family. Thanks to its locking mechanism, SEGGER J-Link is the only debug probe that lets you debug both cores at the same time, with the same probe, in two different IDEs / debuggers.
For additional information on how to work with the NXP i.MX RT600, please check out our Wiki article here: https://wiki.segger.com/i.MXRT600.